
By Alan Austin: Michael West Media.
The Coalition as “superior economic managers”? The data demonstrates the polar opposite. Alan Austin looks at the leading measures of economic performance over 10 years and finds Australia has slumped sharply against other nations. The bright spot? Corporate profits.
A federal election is looming. We are told by commercial radio and TV, the daily newspapers and even the ABC that the election will be decided on economic management. They all agree, in varying degrees, this means returning the Coalition.
The two latest ABC Four Corners programs explored in some depth the political views of ten thoughtful undecided voters and a number of professional commentators.
None indicated the slightest awareness that Australia had the best-performed economy in the world during the last Labor period, nor that Australia’s economy today ranks outside the world’s top twenty. Several asserted confidently that the Coalition always manages the economy better than Labor.
Zombie doctrines
This is a classic example of what Paul Krugman calls a zombie belief – “a doctrine that has repeatedly been proved false, but refuses to die; instead, it just keeps shambling along, eating people’s brains.”
Comparing Australia’s economy today with a decade ago – at the same stage in recovering from the previous global recession – is instructive. It is also quite simple, which is why it is quite negligent for mainstream economic writers to refuse to do so.
It is true that, through the GFC and for three years later, Australia was uniquely positioned on the world stage as an enormous commodity exporter to China.
Still, the numbers are the numbers; and there is no doubt Australia has slumped under the stewardship of the federal Coalition governments.
Income per person
Australia’s gross domestic product (GDP) per capita in 2011 was US$62,574 (AU$59,032), which was the fourth highest among the developed OECD nations, behind small nations Luxembourg, Norway and Switzerland. That, according to the World Bank, was up from 18th place just five years earlier.
By 2021, GDP per capita had slumped to US$51,693, ranking 11th in the world.
Median wealth
Australia had the world’s highest median wealth per adult in 2010 and 2011, according to Credit Suisse. In 2011, Australians owned US$211,704, streets ahead of Luxembourgers with $164,720 and Italians with $155,953.
Australia’s supremacy gradually slipped after 2013 as revenues flowed out of the country untaxed. The 2021 wealth report shows median wealth at just US$238,072, well behind Luxembourg with $259,899 and just ahead of Iceland’s $231,462.
Credit ratings
Australia surprised global markets in November 2011 when ratings agency Fitch gave Australia its triple A credit rating for the first time in its 100-year history, thus completing the set. Australia was the only nation to gain an upgrade during the global financial crisis (GFC).
Economic freedom
In 2011, Australia remained first in the OECD on economic freedom, a variable which Heritage Foundation claims signals “effective democratic governance. It empowers people to exercise greater control of their daily lives.”
Australia rose from fifth place in 2006 to top spot in 2009 – where it stayed until 2015. The latest ranking, released last week, shows Australia has now collapsed from first in the OECD and third in the world, behind Singapore and Hong Kong, to a dismal tenth in the OECD and 12th in the world.
Economic growth
Australia’s annual GDP growth rate in December 2011 was 3.46% which ranked seventh in the OECD, behind Chile, Estonia, Israel, Switzerland, Poland and Mexico.
The latest annual GDP growth numbers, for the September quarter last year, shows Australia ranking 26th among those 34 comparable economies.
Unemployment
In December 2011, Australia’s jobless rate was 5.20%. That ranked sixth in the OECD, behind only Japan, Norway, Switzerland, Mexico and South Korea.
In December 2021, the reported jobless rate was 4.16%, which is significantly lower than ten years ago. But as the world post-GFC has shifted into a high employment phase, this only ranks a modest 13th.
(As noted here last week, the current number of “employed” includes an extra half million public servants, which is more than three per cent of the workforce.)
Productivity
Defined as GDP generated per hour worked, productivity boomed in the Labor years, finishing 2011 on an all-time high 92.7 index points. That was 2.0 points higher over the year and up an impressive 4.6 points over the preceding three years.
In contrast, productivity has only increased 0.1 point over the last year to 102.6 points, and just 2.4 points over the last three years.
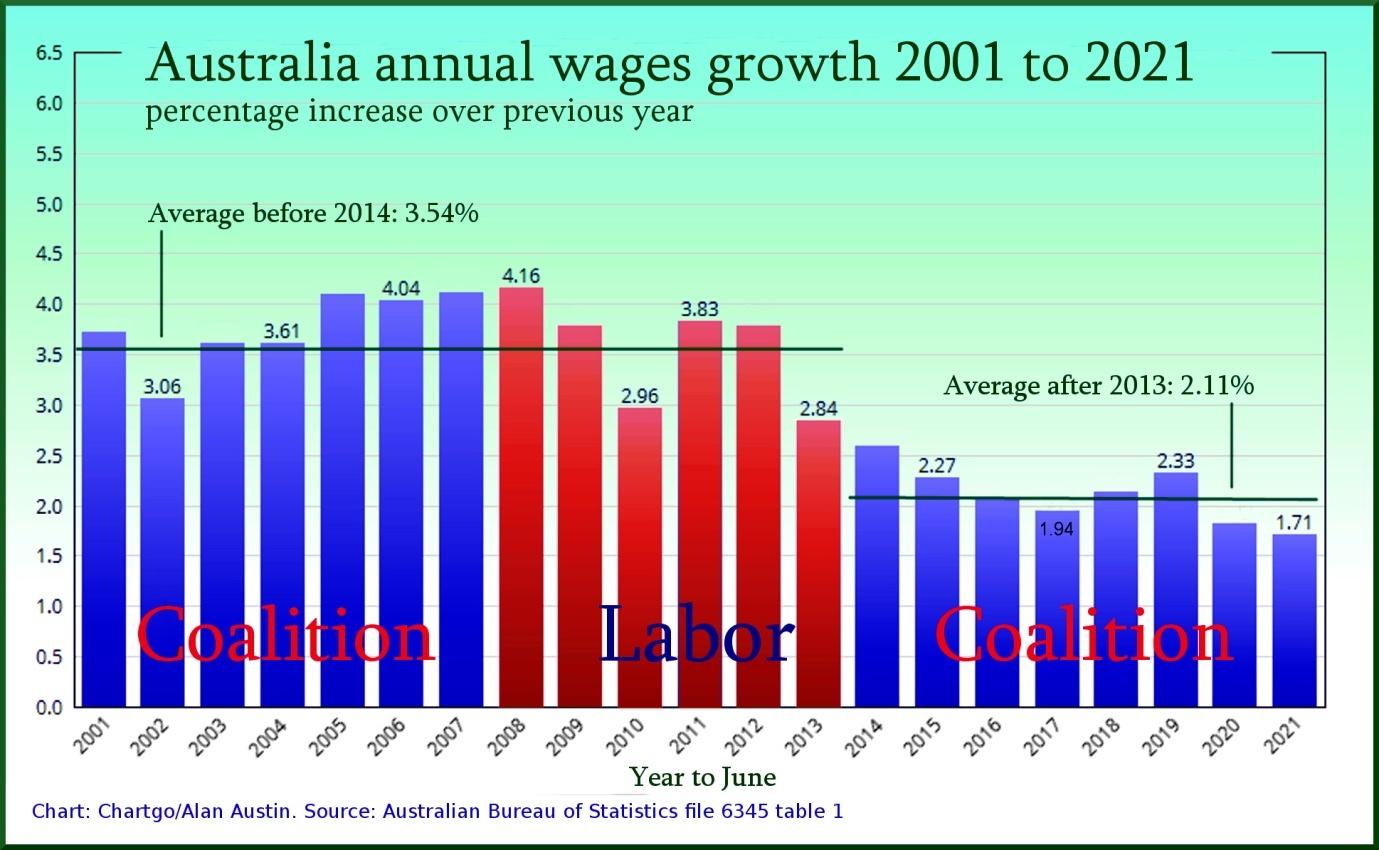
Wage rises
Wages increased 3.83% in 2011, but by less than half that in 2020 and 2021.
Government debt
The International Monetary Fund shows Australia’s gross debt in 2011 was 24.1% of GDP, which ranked fourth in the OECD, behind Luxembourg, Chile and Estonia. By 2020, the percentage had blown out to 63.1 and the ranking tumbled to 20th.
Value of the Aussie dollar
From below 64 US cents in January 2009, the Australian dollar climbed in value to $1.06 cents by the end of December 2011. It remained high – thus enhancing the wealth of all Australians – until mid 2014, when the steady devaluation set in. Latest level, yesterday, was a paltry 71.8 US cents.
Interest rates
Australia was one of only two OECD countries which kept interest rates within the optimum band of 2.6% to 4.8% through the GFC, from 2008 to 2013. The other was Mexico. Interest rates have tumbled disastrously since then and now sit at a rock bottom 0.1%.
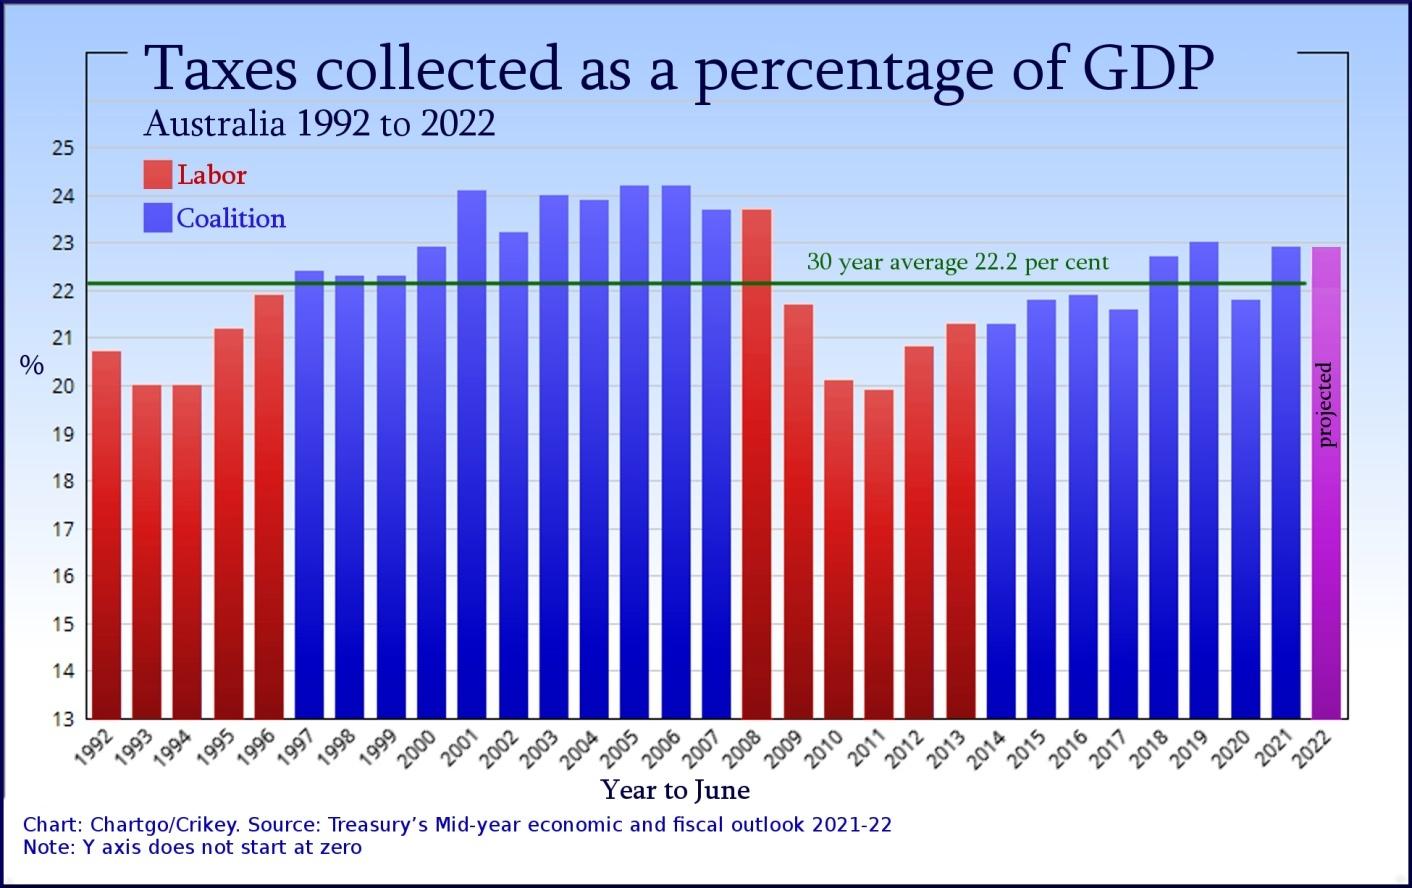
Taxation to GDP
According to Treasury’s MYEFO, the total tax take relative to GDP in 2011 was the lowest on record, at just 19.9%. The impost increased steadily after the 2013 election, reaching 21.8% in 2015, 22.7% in 2018 and peaking at 22.9% in 2021.
Other variables
We could also look at household spending, pensions and benefits, infrastructure investment, manufacturing, retail sales, budget deficits, inflation and corruption rankings and see this pattern repeating. These are all historically stronger under Labor than the Coalition.
The main variable higher under the Coalition is corporate profits.
International accolades
There is no question Australia’s economy overall between 2009 and 2013 was the world’s best-performed, based on all key indicators, albeit uniquely assisted by its status as a huge steel and coal exporter during the China boom. Next-ranked economies were Switzerland, Luxembourg and the United Arab Emirates, probably in that order, but a long way back.
The world was watching. Australia was awarded both infrastructure minister of the year and world’s best treasurer in 2011. The former was given to Anthony Albanese, who also won aviation minister of the year in 2010.
The 150-plus economists and other commentators who have expressed admiration for Australia’s economic ascendancy through the GFC include Joseph Stiglitz, Henry Paulson, Timothy Geithner, Stephen Martin, Bruno Martorano, Pádraig Collins, Fabrizio Carmignani, Ken Henry, Rodney Tiffen, Mark Thirlwell and Stephen Bell and Paul ‘t Hart.
Today, Australia ranks well outside the top twenty economies on overall performance, trailing many OECD economies and the UAE, Taiwan, Hong Kong and Singapore. The decline in rankings on the main indicators over the last eight years has been greater in Australia than in any other country.
Yet the undead notion that the Coalition is superior at economic management keeps shuffling along, no matter how many rotting body parts it leaves in its trail. https://www.michaelwest.com.au/treasurer-measurer-exploding-the-liberal-election-myth-of-superior-economic-managers/embed/#?secret=O2xQZt3Mxh
Alan Austin is a freelance journalist with interests in news media, religious affairs and economic and social issues. You can follow Alan on Twitter @alanaustin001.
You can see other pieces by Alan Austin published in A Sense of Place Magazine here.