By Robert Carling: Centre for Independent Studies
As the end of the Australian financial year approaches, thoughts often turn to taxation and how to minimise it (legally). While the focus is on income tax paid to the federal government, the reality is that individuals and businesses are constantly paying a wide range of taxes; not only to the federal government but also to state and local governments. On one count, there are at least 125 different taxes in Australia, although 10 of them account for 90% of the revenue.[i]
Any tally of how much we have paid in 2023-24 must include all these taxes, and not just those levied by one government. At the level of the individual, all taxes come out of the one income — whether they go to Canberra or to state governments. We don’t have a different income to finance our share of each type of tax.
When all taxes are brought into the picture, it can be surprising just how much tax we pay. Hence, the income tax cuts that come into effect on 1 July are put into a different perspective; in fact, they will be only about 3% of a year’s total taxation. For this reason, the focus of this report is on total taxation at all levels of government, and the shares of each level of government — federal, state and local — are of secondary importance.
Tax as share of GDP at market prices
By far the most commonly-cited measure of the overall tax burden is tax revenue as a percentage of GDP, and while it is never made explicit, this is GDP estimated at market prices. (The distinction between this and the ‘factor cost’ measure is important, as we shall see later.)
The highest this measure has ever been in Australia — at least since the Second World War when taxes were very high to finance the war effort — was 30.3% in 2000-01, but it has fluctuated around an average of 28% since the 1990s; before which the average was lower, and much lower in the 1950s and 1960s. (See Figure 1.)
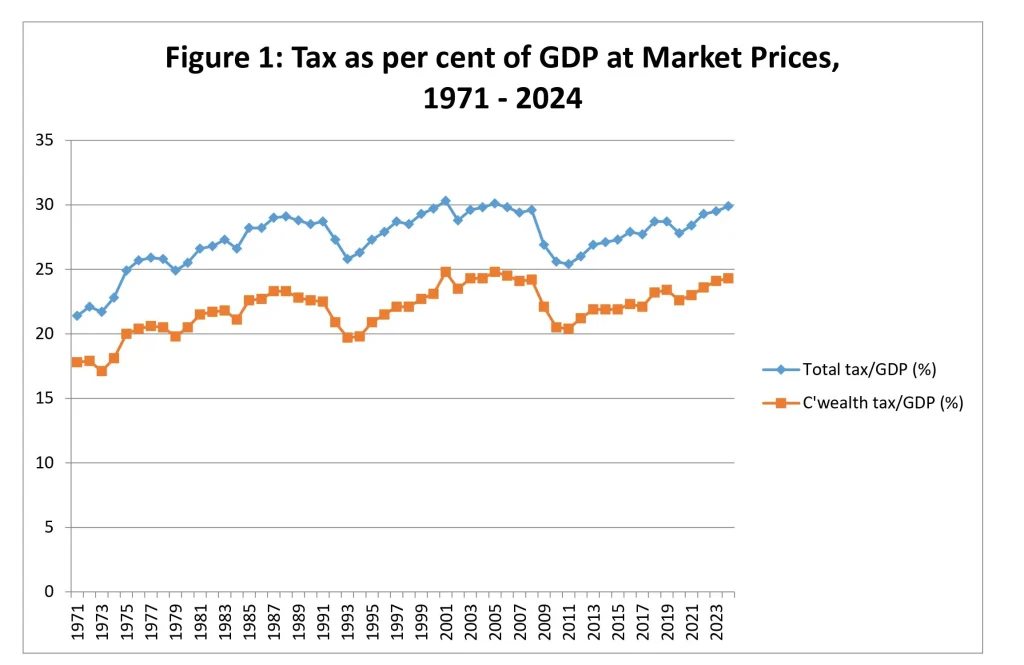
Significantly, this tax share has been rising in recent years (subject to some disruption during the Covid-19 pandemic) and, based on federal and state government mid-year budget reviews, it is likely to be close to 30% in 2023-24. It is fair to say this measure of the tax burden is close to the highest it has ever been in peacetime.
This tax share is the outcome of many variables and tax policy decisions by different governments and is not something any one government or the National Cabinet targets or can be held accountable for. But it is an important variable that National Cabinet should be concerned about and coordinate efforts to control.
The federal government alone does not have a fiscal rule for a particular tax/GDP ratio. The previous Coalition government set a ceiling of 23.9% of GDP (based on the average for a period of years in the past) but the newly elected Labor government abandoned this in 2022. This may be because, in practice, the ratio is impossible for any government to control with any precision. But the more likely reason is that the new government aspires to spend more freely and does not wish to be constrained by a tax ceiling.
It is somewhat ironic that the record of 30.3% occurred under the Coalition government in 2000-01 even though that government espoused the benefits of lighter taxation. The federal government was not responsible for the national tax total, but the federal component of the total was also at a record level of 24.9%, which was repeated in 2004-05. However, to be fair to the Howard government, it did implement major personal income tax cuts from that point onwards, which led to the federal tax/GDP ratio shrinking to a low of 20.4% in 2010-11.
The tax/GDP share is widely cited and is the most readily available measure for consistent international comparisons. However, in other respects it is not the best measure of the tax burden because GDP is not a tax base. We expand on this below.
Tax Freedom Day
The tax/GDP ratio has been popularised first in the US, and later in Australia (by the CIS) as tax freedom day, which expresses the ratio in calendar days as a measure of how far into the year the economy is working only to pay taxes.
When the tax/GDP ratio was at its peak in the 2000s decade tax freedom day was 22 April in calendar year terms or 20 October in Australian financial year terms. This means that if all the economy’s output went to paying tax until the year’s tax demands were satisfied, the economy would have worked entirely for government for the 111 days until 21 April and be free of tax from 22 April until the end of the year. (See Figure 2.)
Figure 2: Tax Freedom Day Since 1968-69
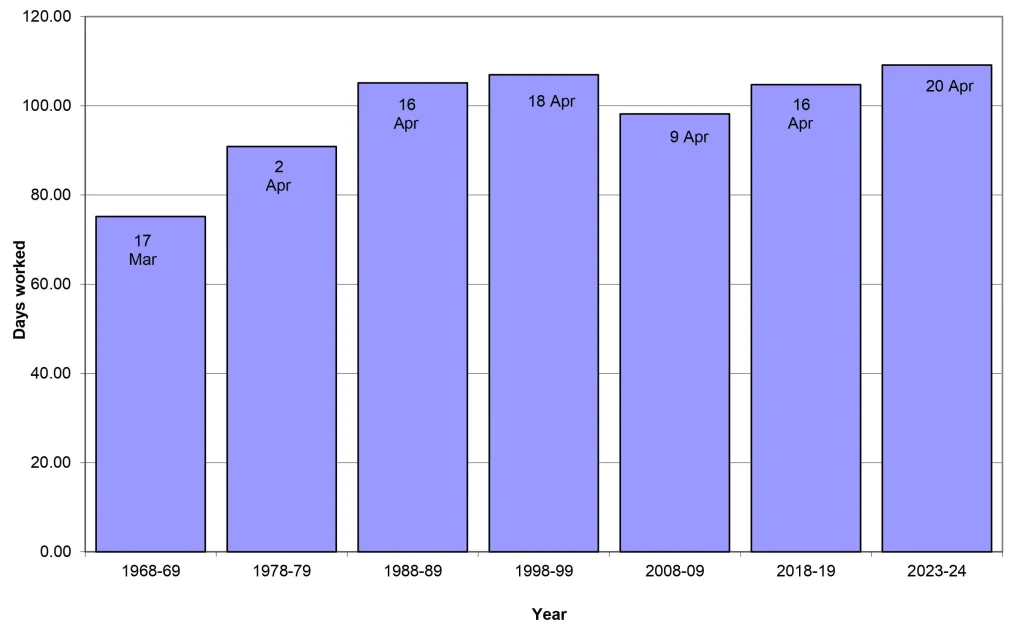
The estimate of tax freedom day this year is 20 April in calendar year terms, or 18 October in financial year terms. Although the day has been slightly later a few times in the past, until the 1990s it was generally much earlier in the year.
The concept of tax freedom day is useful in reformulating the tax/GDP ratio in a way that is understandable to more people and in facilitating comparisons with the past and with other countries but suffers the same defects as that ratio as a measure of the tax burden.
Tax on households
If we want to focus on individual people as taxpayers, rather than entities such as companies and superannuation funds, then in national accounting terms we need to look at the household sector.
There are relatively few of our vast array of taxes for which individuals are directly accountable. Personal income tax, local government rates, motor vehicle taxes, stamp duty on property transactions and land tax are the main ones. Businesses are accountable for paying many other taxes. Yet tax theorists often assert that the ultimate burden of all taxation can be traced to individuals.[iii]
This apparent contradiction rests on the distinction between the legal and economic incidence of taxes. Taxes for which the business sector is legally responsible are in effect passed on to the household sector through higher prices and lower wages and shareholder returns.
The Goods and Services Tax (GST) is a good example of this: businesses are legally responsible for paying the GST and they collect the revenue by building it into the prices they charge consumers. Likewise, businesses collect excise duty in the petrol prices they charge consumers and send the money to the government.
These are obvious examples, but less obvious are taxes like payroll tax and company income tax. The legal incidence clearly falls on businesses but there is much research concluding that the economic incidence is passed on to the household sector in less obvious ways such as wages being lower, prices higher and shareholders’ dividends and capital gains being lower than they would be in the absence of such taxes.[iv]
Household income in the national accounts includes not only factor income but also various transfers from other sectors, including social benefit payments by government. Gross household income in 2023-24 will be around $2.1 trillion. However, this includes ‘pretend’ income such as that from owner-occupied dwellings. If we exclude this, then in the extreme case of the economic incidence of all taxes falling on households, the tax burden so defined would be 45%.
If we exclude company income tax, petroleum resource rent tax, payroll tax and land tax (most of which is paid by businesses) from tax incidence on households, then they bear a tax burden of about 35% of income.
As it is unlikely the economic incidence of all these taxes falls on businesses, or that all of it falls on households every year, the truth lies somewhere between 35% and 45%. In either case, it is a heavy burden and much heavier than most people would realise.
Conclusion
A measure of the total tax burden is important to understanding the impact of government intervention on the economy. It is by no means the only information relevant to that assessment, but it is an important part of the overall story.
The various measures of the tax burden include tax revenue as a percentage of GDP at market prices and at factor cost, tax freedom day, revenue as a percentage of total private income in the economy, revenue as a percentage of household income, and revenue per capita.
These measures point to a growing tax burden in recent years and a level in 2023-24 likely to be about as high as it has ever been. Tax as a percentage of total private income in 2023-24 is about 34% and as a percentage of household income it is at least 35% and as high as 45% depending on assumptions made about tax incidence.
Medium to long term projections of government expenditure suggest there will be pressure to increase the tax burden further to record levels unless federal and state governments make a concerted effort to curb the growth of spending and make it more effective in achieving its objectives.
To read the full report The Truth about the Tax Burden from the Centre for Independent Studies go here.